IE 421 – Data Science for Engineers
Flight Delay Propagation & Operational Congestion Analysis
Introduction
This project analyzes operational inefficiencies in airline systems using the 2015 U.S. Flight Delays and Cancellations Dataset. By focusing on delay propagation, temporal congestion patterns, and predictive modeling, we aim to understand how small disruptions escalate within complex transportation systems. In the following visuals, we made conclusions about our analysis
Descriptive Visualizations
Monthly Congestion Patterns
This chart illustrates the monthly congestion patterns observed across 10 major airline hubs. Green bars indicate that the hub's specific congestion threshold has not been exceeded. Red bars signify that the threshold has been surpassed for that month. By analyzing this visualization, we can precisely identify which major hubs experience congestion during specific months. This insight enables airport authorities and airlines to plan their monthly flight schedules more effectively and enhance operational flexibility.
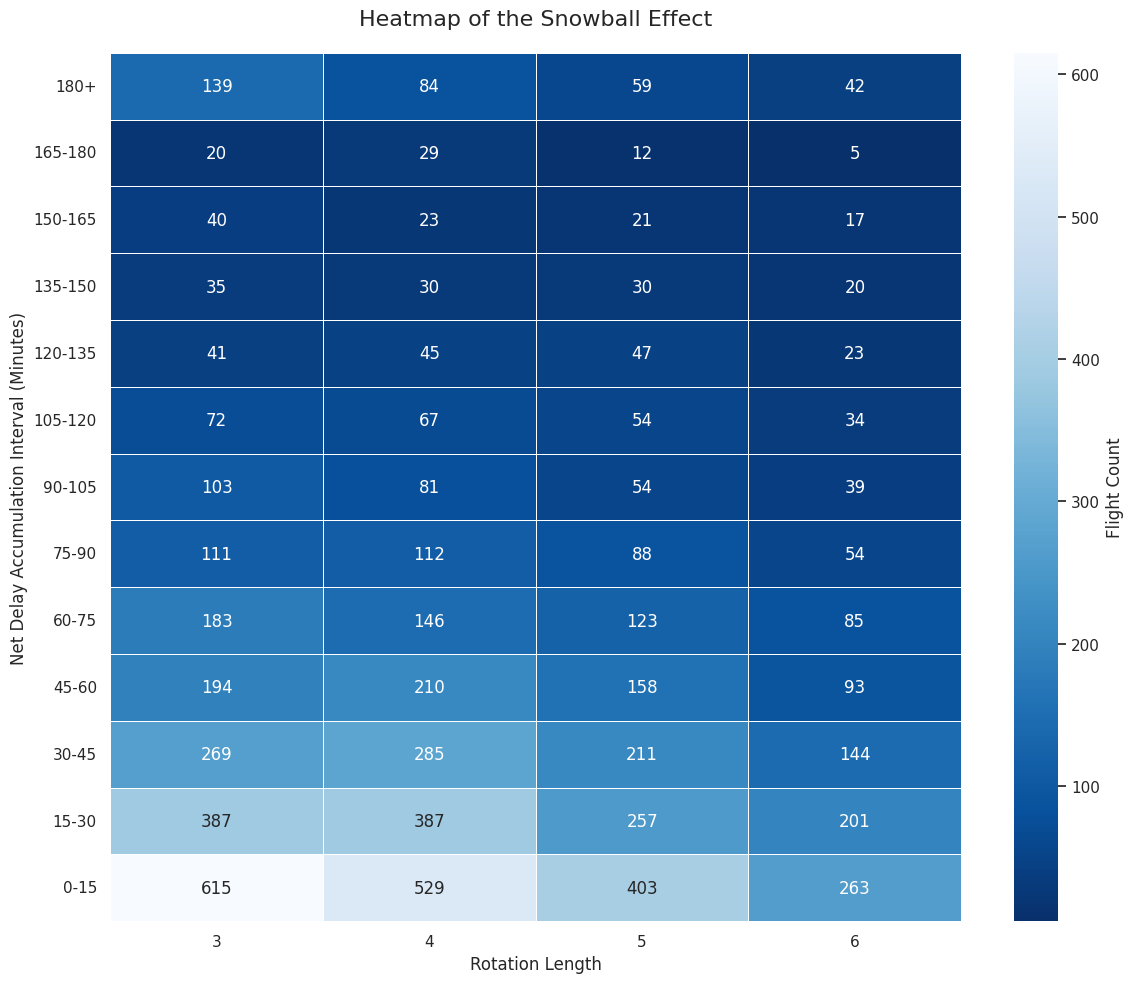
The "Snowball Effect"
This matrix visualizes the "Snowball Effect," demonstrating how flight delays compound as an aircraft completes more flight segments throughout its daily rotation. To implement this analysis, we focused on a specific delay interval of 30 to 90 minutes, a range strategically selected due to its significant impact on flight sector operations. Within this framework, rotation length is defined as the total number of flights a single aircraft performs in a day, while net delay accumulation represents the difference between the initial flight's delay and the final flight's arrival delay. The resulting heatmap uses color density to represent the flight count, where upper cells indicate larger "snowballs"—high levels of delay accumulation—and lower cells represent smaller ones. The analysis reveals that as the rotation length increases, the density of delays shifts toward higher accumulation intervals, confirming that early-day disruptions tend to escalate throughout the schedule. While the data shows that massive "snowballs" are not overly frequent, their existence proves that current progress is open for optimization; the system is not at a deficient level, but there is clear room for improvement to enhance overall operational efficiency.
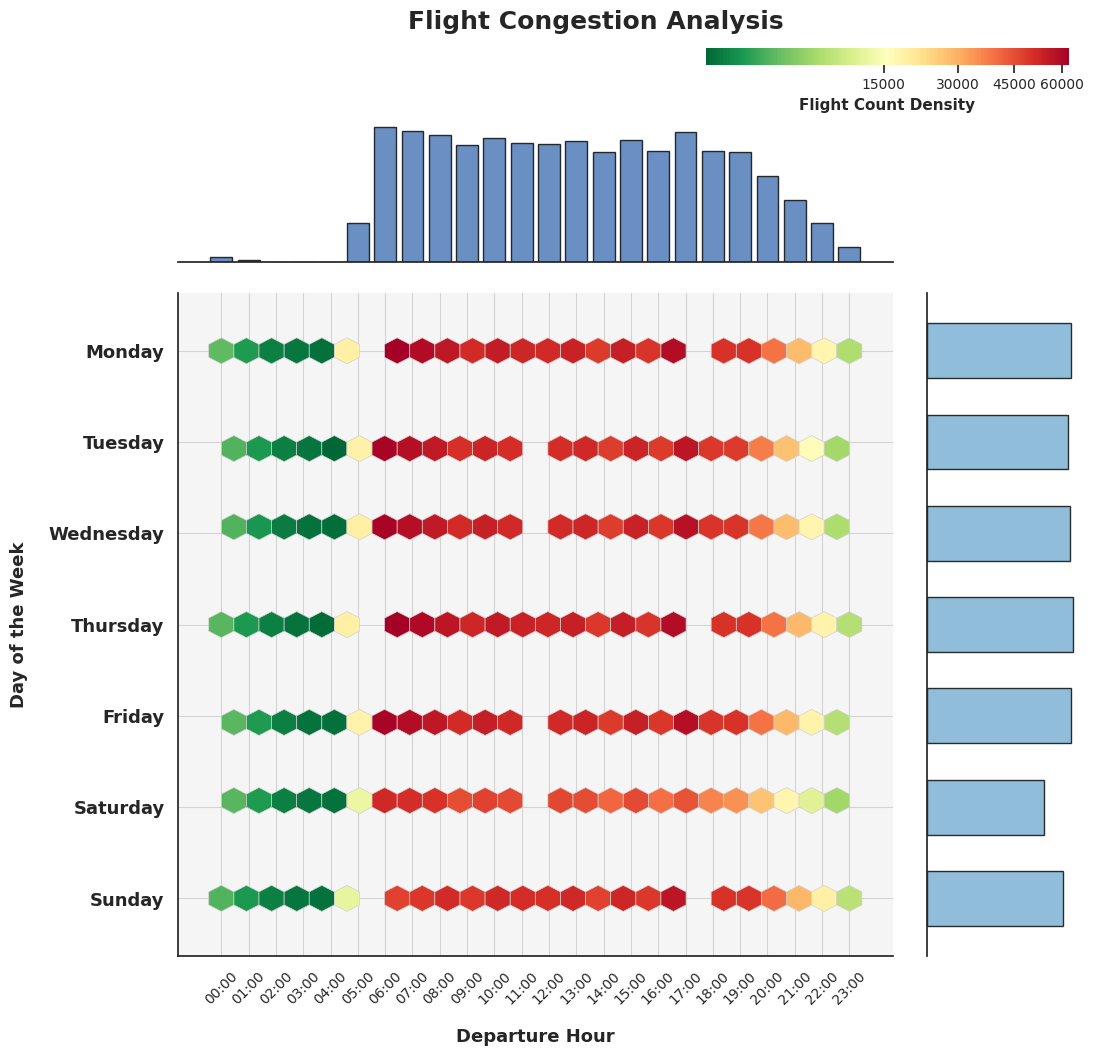
Peak Hour Bottlenecks
Utilizing the complete flight dataset, this jointplot visualization identifies critical bottleneck hours by mapping flight density across the days of the week and specific times of day. The use of hexagonal binning allows for a precise representation of traffic intensity, where red hexagons signify areas of high flight density and green hexagons represent lower activity levels. Certain gaps within the plot indicate periods with no recorded data, a common occurrence in such a large-scale dataset due to natural scheduling intervals or maintenance windows. By pinpointing exactly which hours of each day experience the highest concentrations of traffic, this analysis provides essential insights for airport authorities. This data-driven approach enables more flexible and efficient time management, allowing for optimized scheduling and better resource allocation to mitigate peak-hour congestion.
Predictive Modeling
.png)
Arrival Delay Prediction Model
This predictive model utilizes a Multiple Linear Regression (OLS) analysis to quantify the impact of departure metrics on flight arrival delays. By incorporating departure delay, taxi-out time, and flight distance as independent variables, the model achieves a remarkably high R-squared value of 0.926, indicating that it explains approximately 92.6% of the variance in arrival delays. The regression coefficients reveal that departure delay is the strongest predictor, with a near one-to-one correlation (0.996), suggesting that delays at the gate translate almost directly to the final arrival time. Additionally, the model shows that each minute of taxi-out time contributes approximately 0.78 minutes to the arrival delay, while flight distance has a negligible but statistically significant negative impact (-0.0039), implying that longer flights may offer marginal opportunities for time recovery in the air. The visualization highlights the strong linear relationship between the predicted and actual flight records, providing a robust statistical framework for forecasting operational disruptions. Overall, these findings demonstrate that arrival delays are highly predictable based on early-stage departure metrics, offering a reliable tool for airlines to anticipate and mitigate schedule deviations.